Planogram Optimization
Visualize FIRST in a digital twin.
Visualize, iterate and test in-store concepts
Collaborate in real time, from anywhere
Speed up review cycles and go-to-market
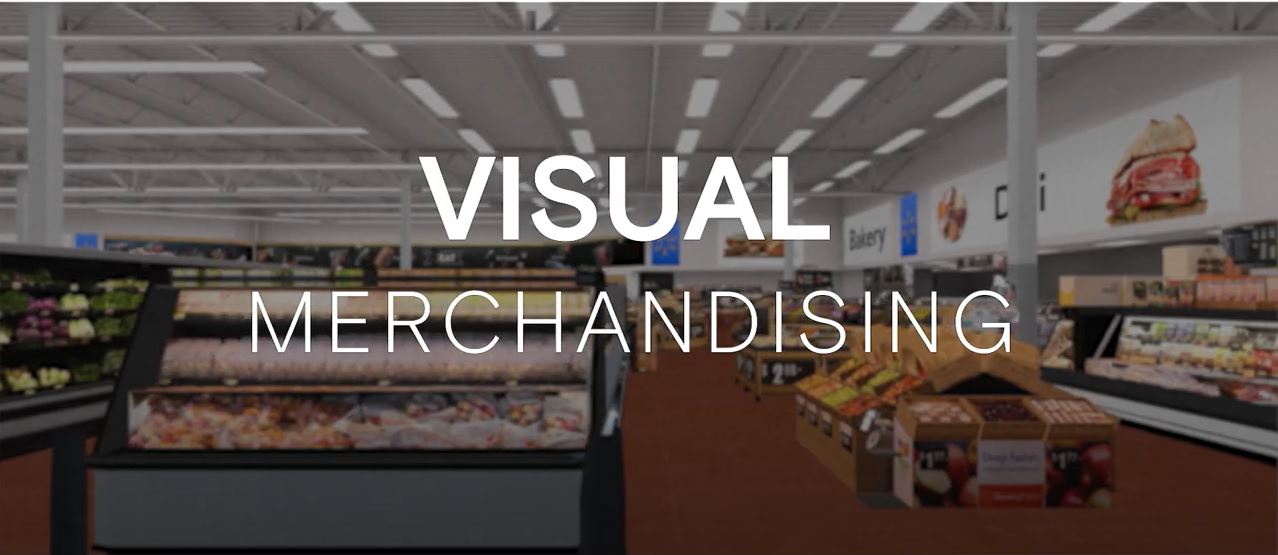
Making changes to a physical retail space is expensive and time consuming–we can help you visualize first and perfect your plan, before investing in the physical space. Our 3D visualization and collaboration platform, ShopperMX, gives you the power to skip the prototyping, the mock centers, and the clunky PowerPoints.
Whether it’s visualizing your new product on the shelf, collaborating with internal teams on a new category concept, or presenting your recommendations to retailer partners, virtual allows you to maximize efficiency and minimize barriers.
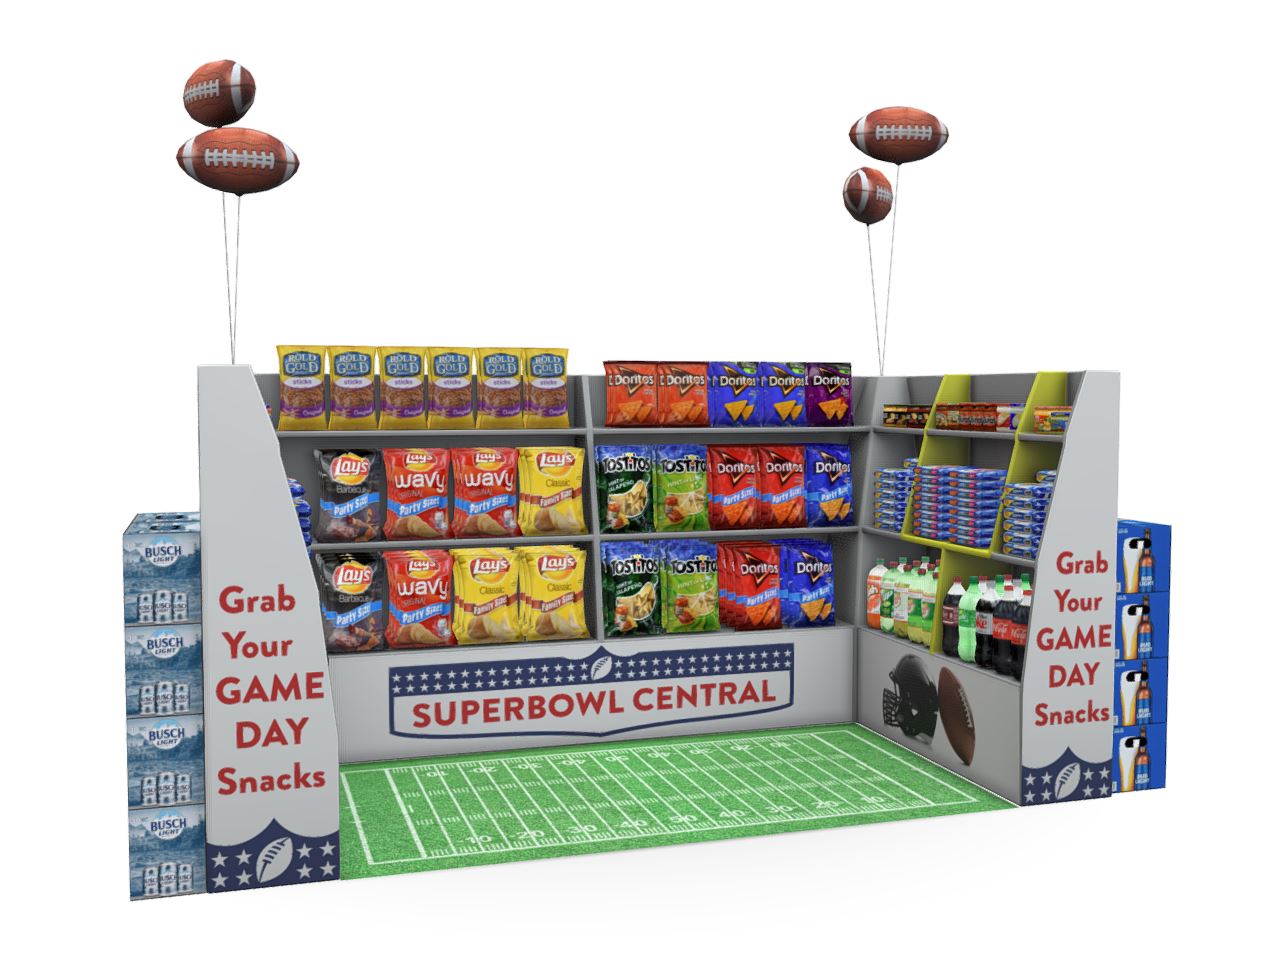
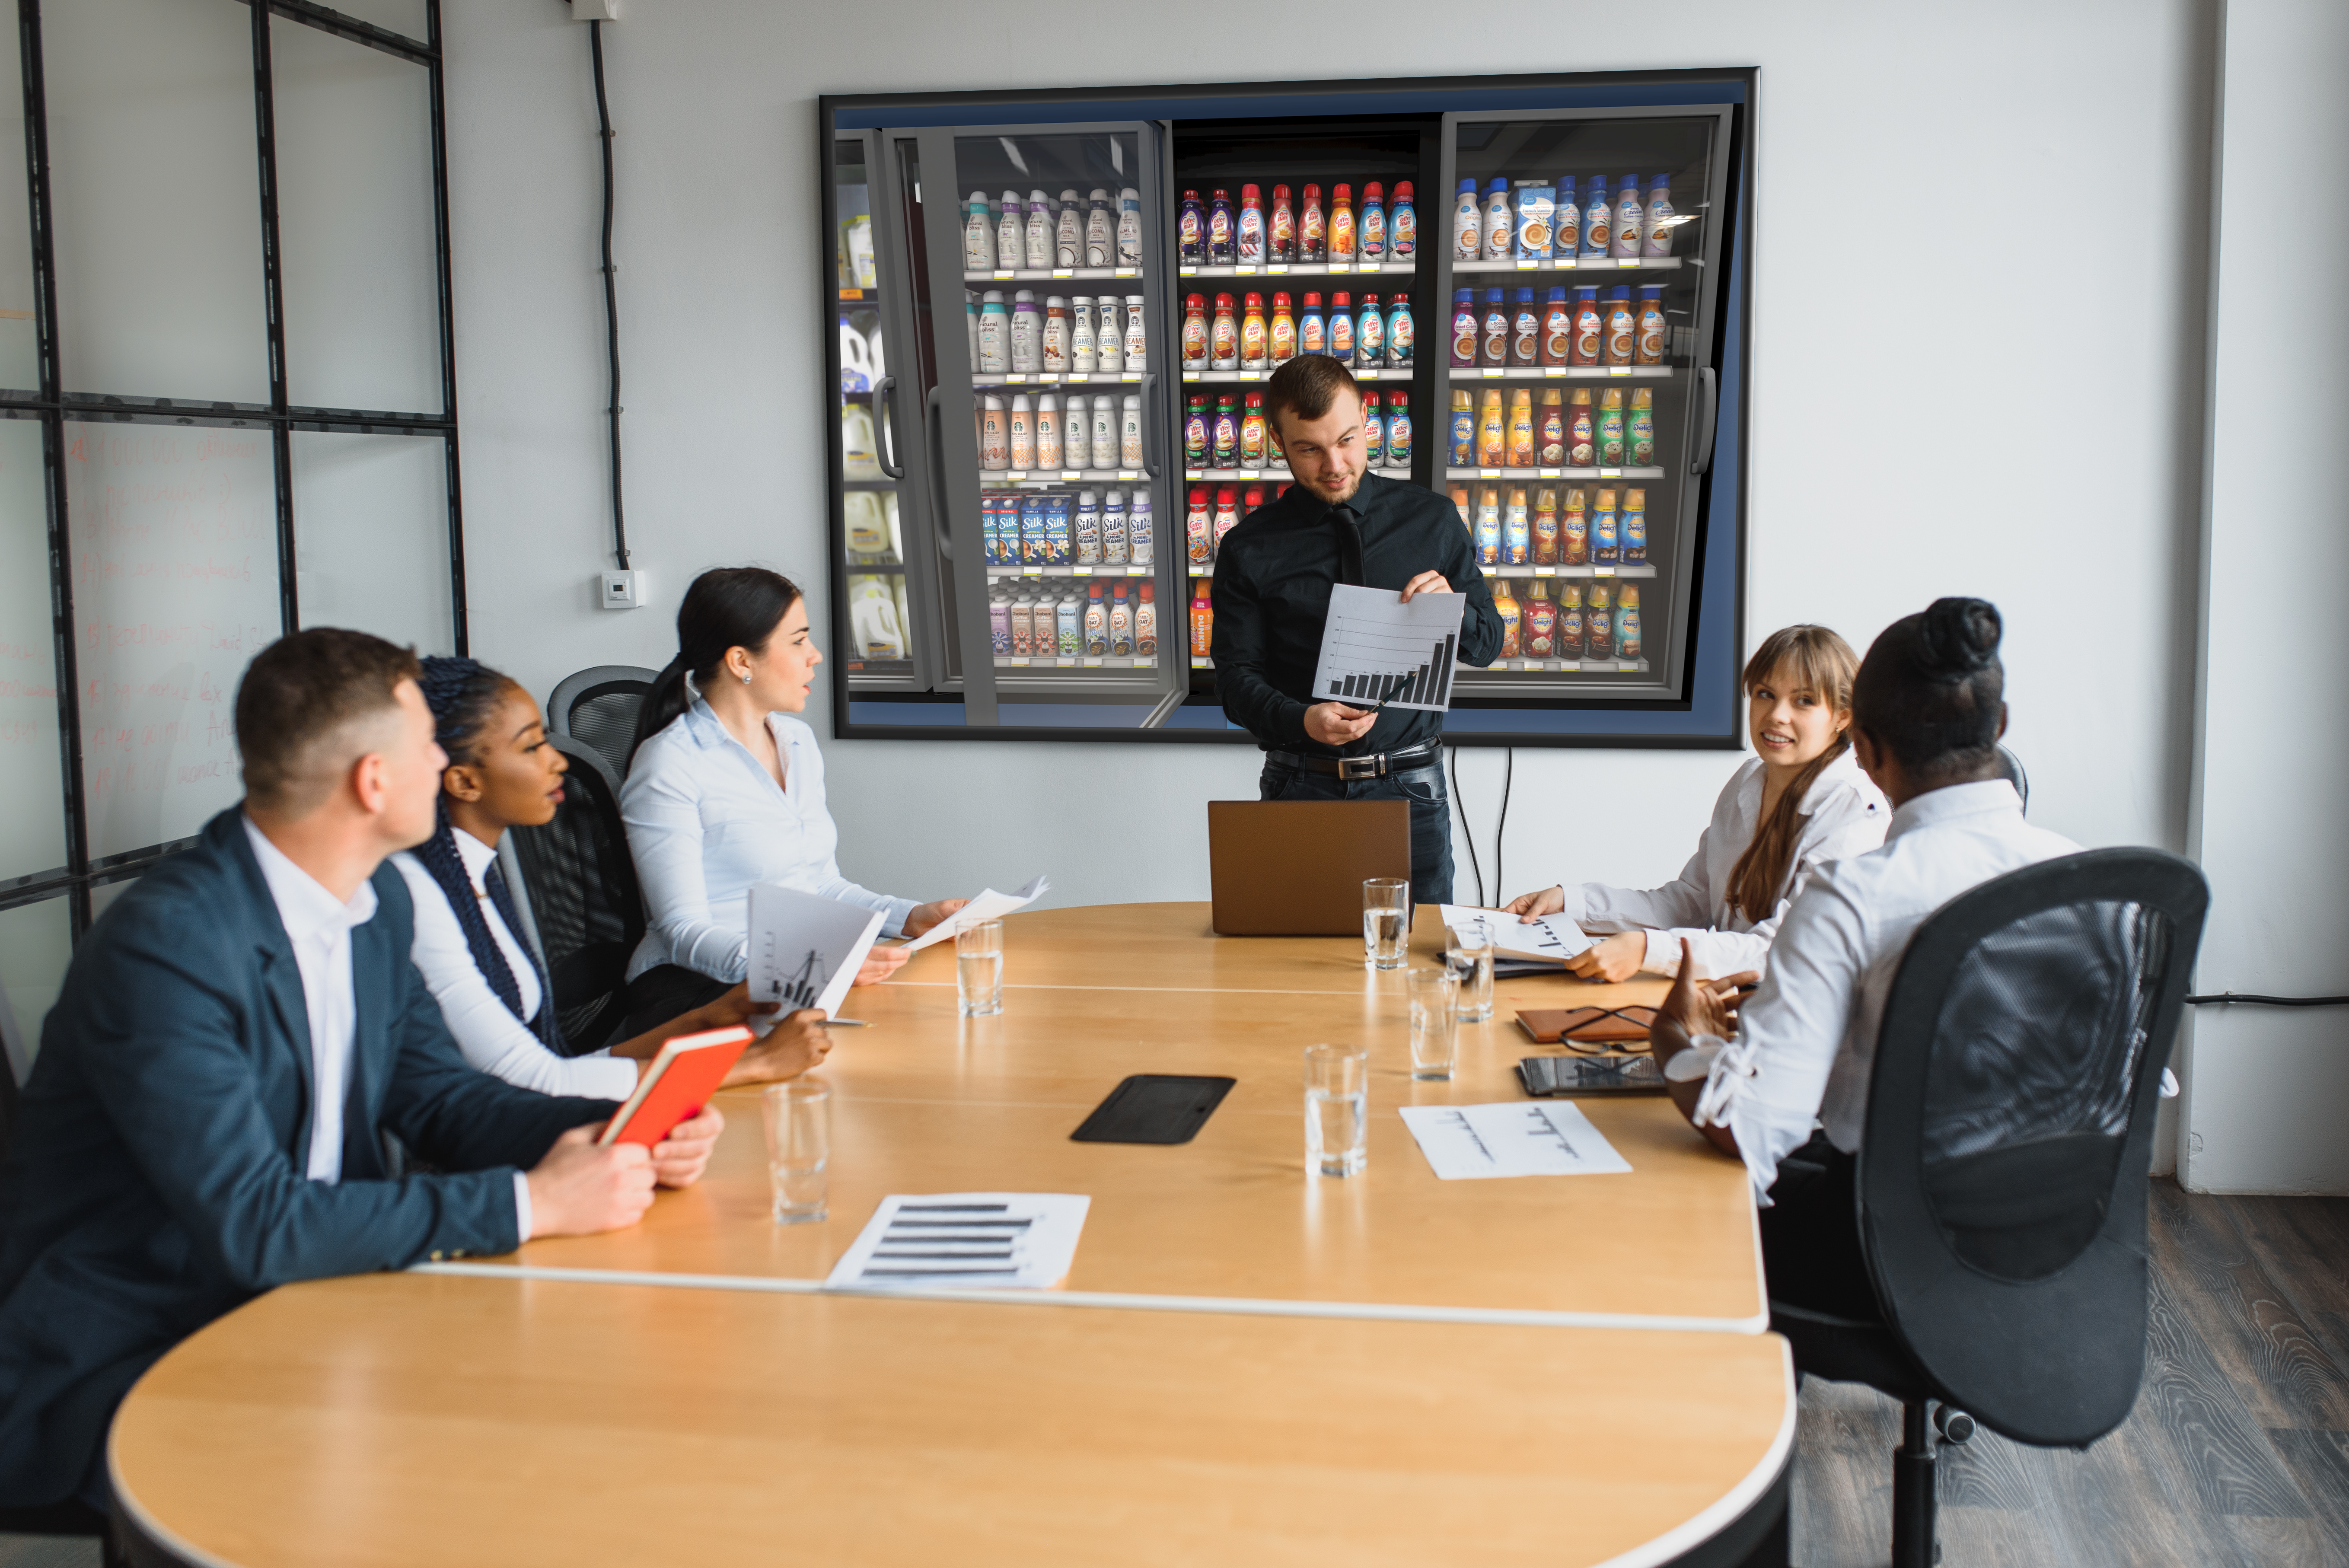
It’s time to go beyond video calls and screen shares. In a world where speed to market is imperative, remote work is standard, and industry trends need quick response, progressive brands and retailers are turning to virtual retail technology to elevate their go-to-market process and stay ahead of the competition.
When working with InContext, you gain the best in 3D visuals combined with tools that enable scale. Our cloud-based platform delivers real-time store collaboration and editing. Our 3D store environments are to-scale and fully merchandisable for complete flexibility. With integrations to your digital SKU content providers, automatic 2D to 3D product modeling, and ingestion of key merchandising files like JDA, InContext is the preferred partner in the retail industry.
Whatever you can do in the physical world, we can seamlessly replicate in a digital retail store twin.
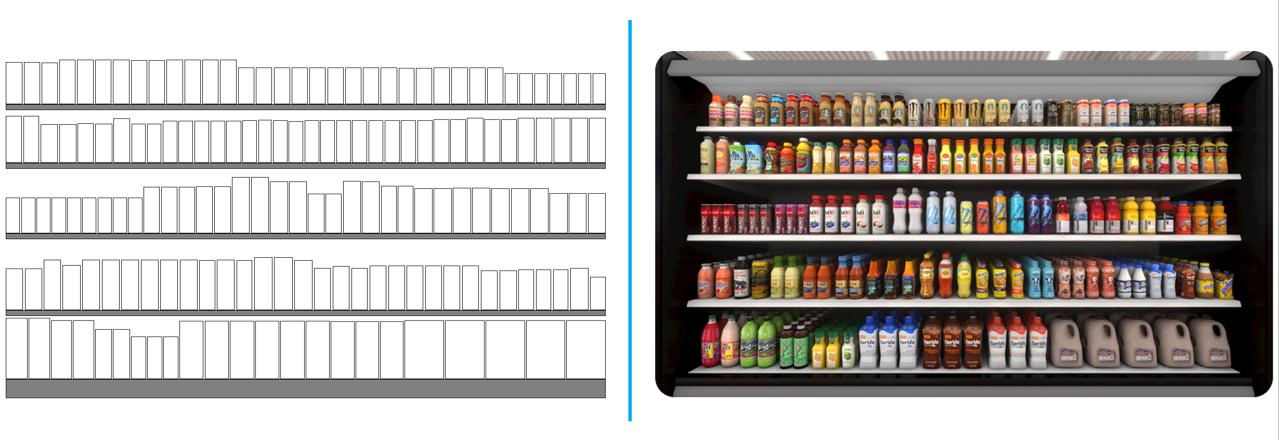
Bring prototypes of new merchandising strategies to life in the context of the store for increased shopper engagement.

Quick Start
Iterate

Present

Customize

Collaborate
Virtual enables your teams to work smarter, together, with tools aimed at streamlining collaboration and enhancing presentations with visuals that pack a punch.
The Virtual Store
Intuitive Store Set-up
3D SKU Ingestion
Waypoints
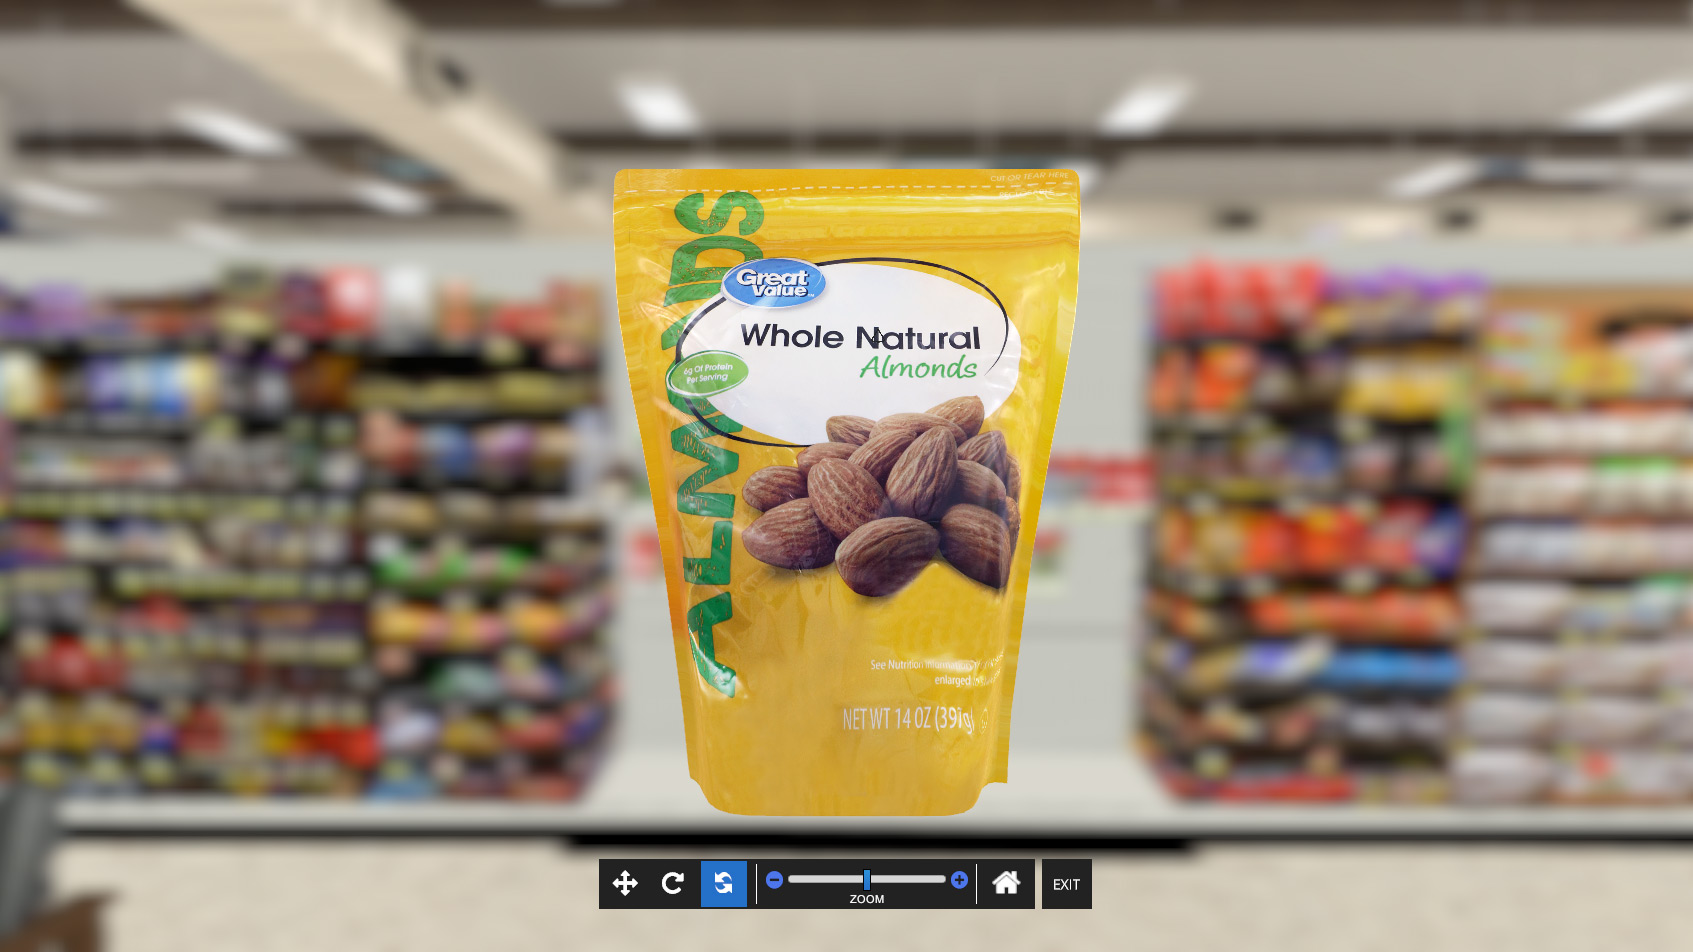
3D Product SKUs
Pinboards
Data Visualization
Virtual Meeting Space
Dollhouse
Case Studies
Success stories from clients
Planogram Optimization FAQs
Frequently Asked Questions
It means improving the profitability of the products offered on the retail shelf and at a store. Planogram optimization requires detailed understanding of shopper preferences, assortment, volume, price, sales, turnover, dimensions data, store layout, and merchandising strategies. The goal is an efficient planogram that incorporates the winning price and promotional strategies. Planogram optimization often is, and likely should be, refined at a local level.
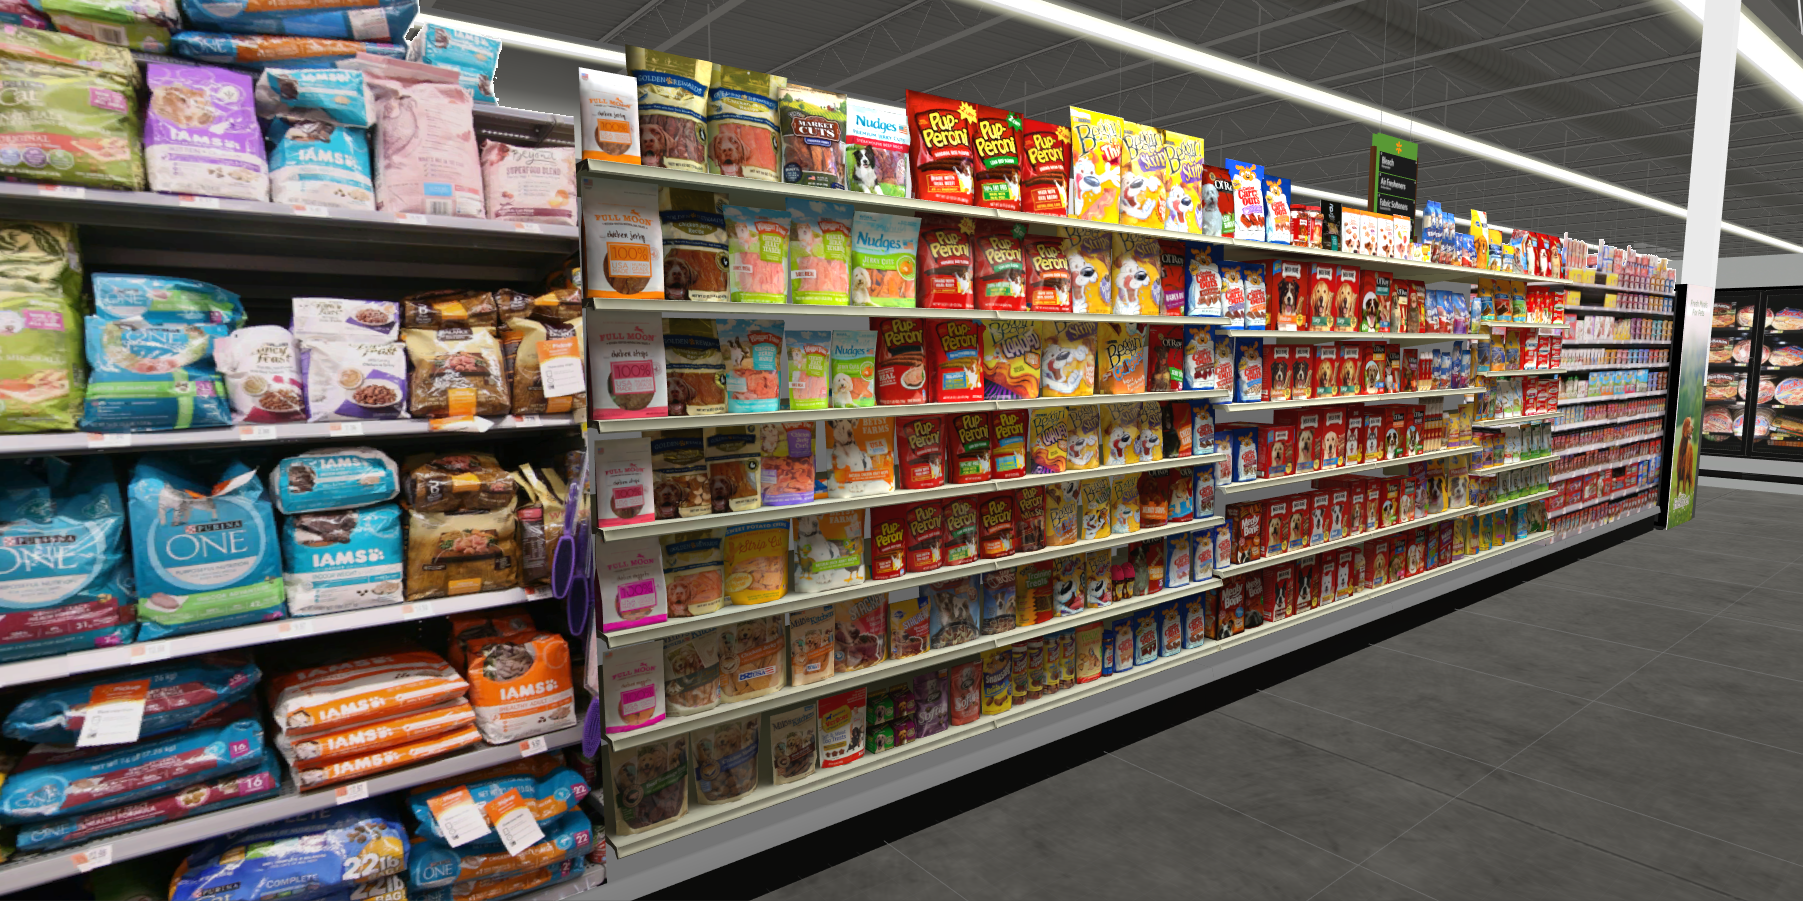
Visualizing a planogram in 3D makes sure that the planogram is not only financially efficient but visually optimized, meaning the functionality is easy for shoppers to navigate and find what they are looking for. 3D visualization takes into consideration not just the assortment (‘what’ products are on the shelf), but the arrangement as well (where they are located relative to each other and adjacent items.) How products are arranged on the shelf can completely change how the shopper interacts with and understands the product categories.
1. Get the assortment right. Start with sales data, identify trends for when products are selling well, what combinations of products are shopper purchasing. Consider how you can use that insight to improve products available.
2. Identify tactical strategies to improve performance. Ensure adequate facings and appropriate location for fast moving items and trip drivers to make sure that people can find and purchase their priority items. Set a logical flow for the category that helps shoppers understand where to find the items they need and encourage add-on items. Consider the total visual picture of the category, and how well it tells the story of the category to a shopper.
3. Set category principles. This creates consistency in the shopper experience and drives efficiency on-going in store operations.
4. Do your research. Understanding the shopper purchase decisions relative to your assortment, arrangement and flow means you can create planograms that make the shopping experience easier and more pleasant. This practice creates greater customer satisfaction and loyalty for both stores and brands.
Anything that changes in the planogram can have an impact on the shopper and their decisions. So, anything you change can and likely should be tested before putting it into a store to ensure a positive outcome. Here are some of the most common things to test:
– Product placement
– Assortment
– Arrangement
– Flow
– Price
– Promotion
– Leading the aisle items
– Eye level items
– Brand blocking
– New item introductions
Day to day tactical, planogram optimization means:
– Having products on the shelf when people want to buy them, avoiding out of stock through appropriate assortment and retail space allocation
– Growing volume of items purchased within the category, building the basket through logical placement and flow
– Maximizing sales of high profit items and creating operational efficiencies for labor through smart item arrangement.
Long term impact of these successful tactics will be a productive category with strong shoppability, leading to shopper loyalty, improved retailer brand and ensuring your category is a destination of choice.
These things go hand in hand. Part of optimizing your planogram is ensuring you allocate the right amount of space to the right products. Without proper space allocation, you might find yourself with excessive out of stock items, or missing items that shoppers deem to be staples. Not having what shoppers want and need in your assortment has adverse effects on the brand and long term negative implications on shopper loyalty.
Planogram optimization is a constant process, because it reflects variables that are constantly in flux: ie. shopper preferences, retailer objectives, new product introductions, general product availability and supply. These types of data and variables are key drivers for planogram optimization decisions. Further analysis of those planogram solutions can be done with shoppers to ensure the response to those variables will result in positive sales performance for the category.
InContext has been the leader in visual merchandising and planogram optimization for over a decade, and we do two things very well:
1. We test the planogram with shoppers. InContext’s proprietary platform and methodology for online quantitative virtual store testing, produces a .9+ correlation with actual in store purchase. What happens in the virtual store is predicting what will happen in the physical world. We test with hundreds or thousands of actual shoppers to give you stat-tested analysis of category, segment, brand and even product level sales. Test planograms before investing in labor or disrupting the store to make sure they accomplish the goal you have in mind.
2. We visualize new planogram concepts in full 3D. Part of the optimization process is visual, and a 2D picture just isn’t the same was walking the aisles of the store in 3D and picking up the products, experiencing associated marketing, pricing and promotional strategies, etc. We enable the true- to-life visual inspection without the cost and complexity of a physical set room or an in-store reset. High resolution 3D product models, 3D stores and photo realistic adjacencies create an experience that is exactly like it will appear to shoppers in the physical store. Perfect for internal approval meetings or retailer/manufacturer Top to Tops.
Our resources center is full of industry-changing insights in the form of blog articles, white papers, case studies, webinars and videos. Here’s a peek at the latest.
