One industry-accepted approach to validating the results produced through Virtual Store testing is to compare shares of “sales” that occur in the virtual environment to shares of sales that occur in real stores. These comparisons can be at the product level, for groups of products and at the brand level.
- For all units of these products or groups of products the correlation is .99
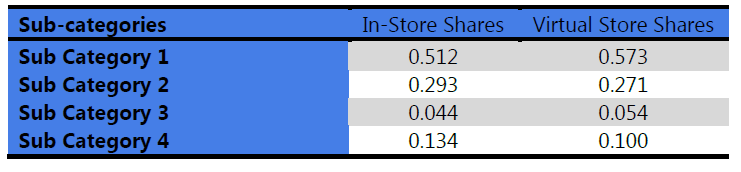
- For the four Sub-categories the correlation is .99
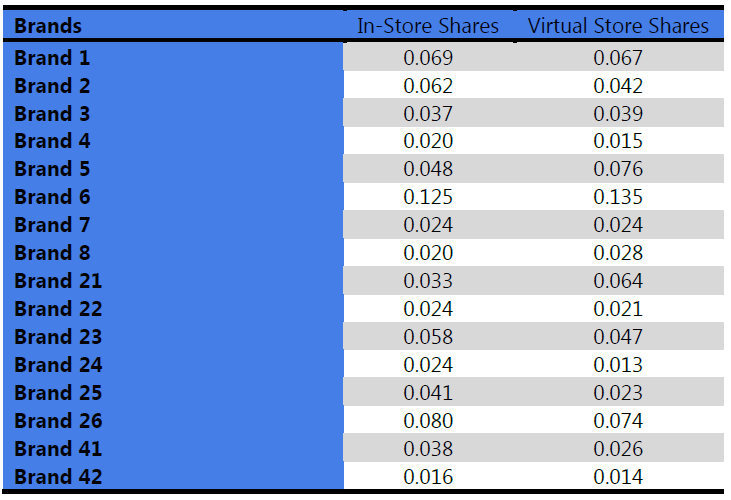
- For the 16 Brands the correlation is .9
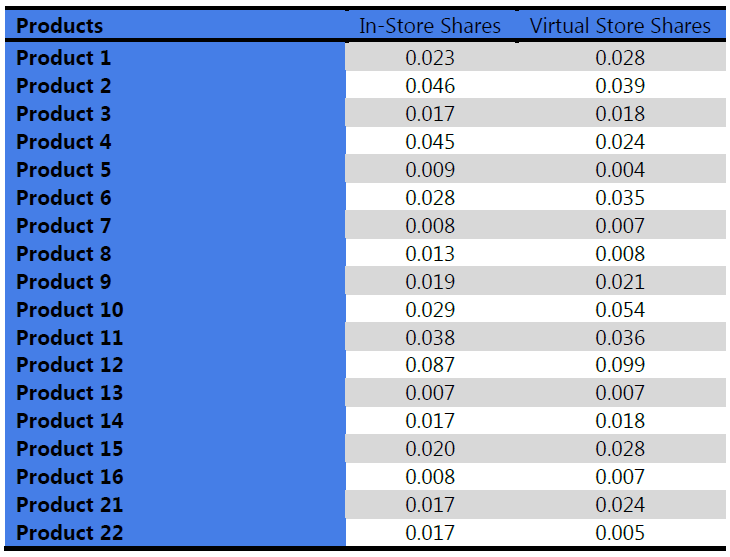
- For the 18 Products the correlation is .91
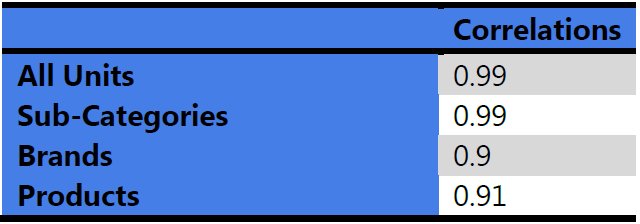
While there were more products included in the study, in-market data could not be obtained for the smallest products. It is expected that share estimates for infrequently purchased products would be less accurate, but that the correlation would remain high as the magnitude of errors for these estimates would not be large.
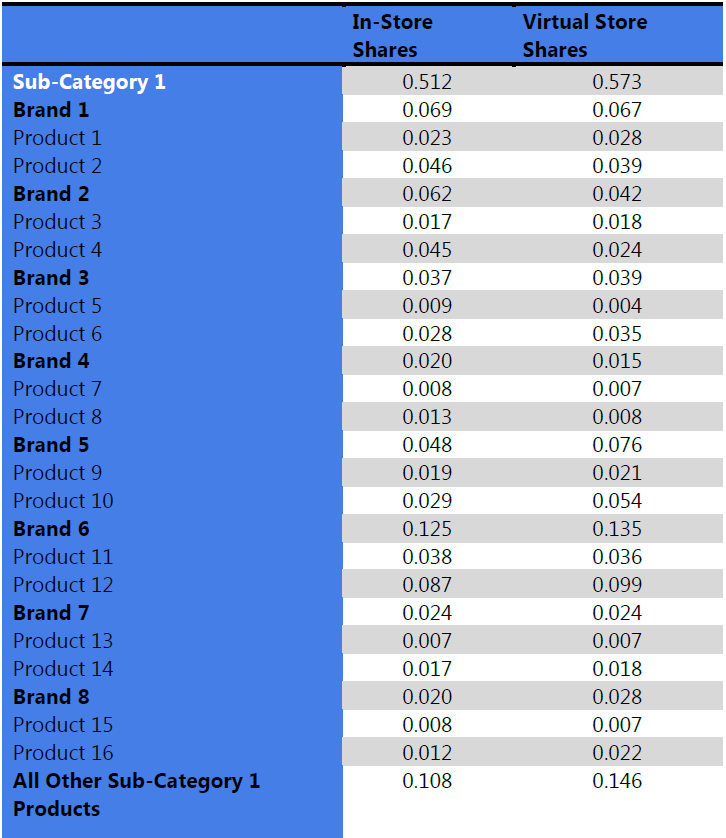
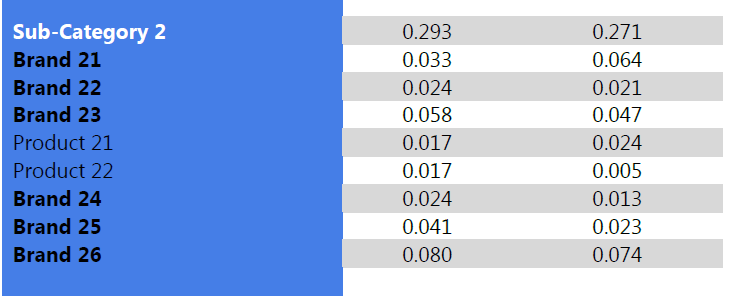
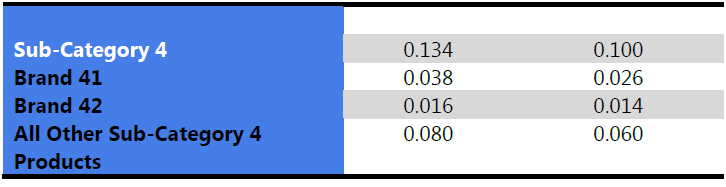
Detailed data showing sales shares broken down by Sub Category, Brand and Product:

Detailed data showing sales shares broken down by Sub Category:
Detailed data showing sales shares broken down by Brand:
Detailed data showing sales shares broken down by Product: